
5 ways mapping can help you increase media impact

Media projects are often judged primarily on their own merit. When it comes to gauging impact, however, context rather than content can be king. Mapping tools can help to reveal that context, making it easier to both design outreach and assess outcomes.
Here are five mapping strategies to consider:
Map the networks
Understanding where—and by whom—a story or production will be distributed is central to crafting an impact strategy. Maps of outlets, such as this visualization of NPR stations, complete with broadcast area, or New America Media’s map of ethnic media hubs, are a good starting point.
More and more, however, audiences hear about media projects through friends and influencers on social networks. Rather than focusing on a particular social platform such as Twitter or Snapchat to start with, it helps to begin with a broader understanding of the dynamics of networks and roles that various actors can play within them, and then to dig into specifics by using visual tools to map network members and hubs.Tools for doing this can be as simple as Post-it notes and markers, or as complex as proprietary software that ingests large datasets and pinpoints influencers and gaps. Here’s a tried-and-true primer on the process and a comprehensive list of mapping tools.

Map the comparables
Media producers and funders working on projects that tackle a particular issue need to understand who else has covered it, how, and whether audiences and stakeholders took action as a result.Often this involves a complex research effort, but for documentary filmmakers, there’s a handy shortcut. The Harmony Institute’s StoryPilot uses a constellation map as a metaphor to show where various films fit within a particular issue universe, and offers comparative data on reach, audience response, network building and more.
Map the synapses
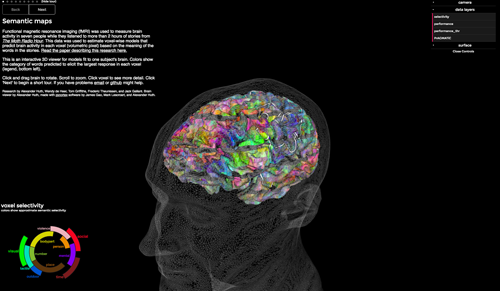
Gut feeling and innate faith in the power of storytelling are no longer enough to demonstrate media impact. More and more, researchers are turning to neurological research to understand the relationship between narrative, emotion and action.
Here, UC Berkeley researcher Alexander Huth shows what happened inside the minds of seven people while they were listening to storytelling radio show The Moth News Hour. Functional magnetic resonance imaging (fMRI) was used to measure blood flow triggered by certain words within the stories—generating in the aggregate a “semantic map” of the regions of the brain that responded to different concepts such as numbers, places, body parts or time.
This type of research is still very new and often somewhat inconclusive, but it is being applied to many different types of media and communications, including virtual reality, political communication and more.
Map the systems
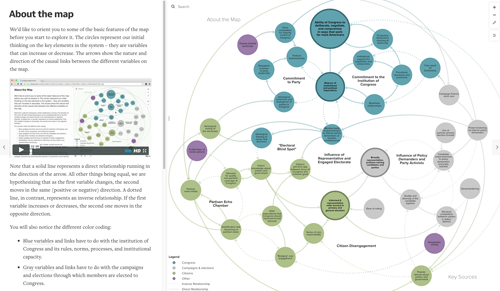
Making media projects that can clarify complex social issues and move viewers to action requires a rigorous understanding of how various interventions might succeed. System mapping offers makers and funders a chance to get all of the factors onto one page, to identify obstacles, gaps and leverage points, and to put different solutions into perspective. Here is an introduction to different types of system maps — including actor maps, mind maps, issue maps and causal-loop diagrams — from Joelle Cook of consulting firm FSG.
Kumu is a tool that’s used to create interactive system maps. See recent Kumu projects such as the Hewlett Foundation’s map of how and why partisanship in Congress causes gridlock, developed for its Madison Initiative, or the Democracy Fund’s system map of the crisis in local journalism. These maps not only serve to distill thinking, but as interactive media in their own right.
Map the money
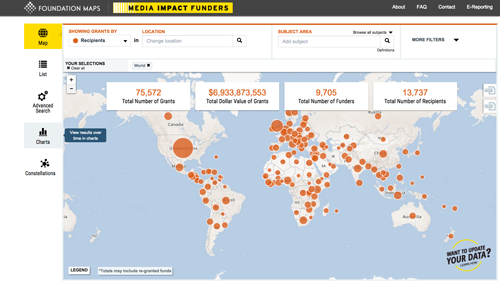
No matter the topic, making media takes resources—and figuring out where production and outreach funds are coming from is a constant struggle for makers. At this week’s Media Impact Forum, we’ll demonstrate our newly redesigned Foundation Maps for Media Funding, updated with support from the Bill & Melinda Gates Foundation and the Wyncote Foundation.
Both funders and media makers can use this tool to research media grants from 2009 through 2015. Browse funders and recipients across the globe, with a special focus on U.S. giving; drill down into funding by subject area, organization type or keyword; or explore the new “Constellations” interface, pictured above, which displays relationships between networks of funders and grantees and allows you to drill down for grant details. Click here for a PDF of the map report.
We’ll be discussing other ways in which maps can both inform media strategy and serve as powerful productions in their own right at our June 28 event. Registration is closed but you can follow the live stream here.
Happy mapping!